
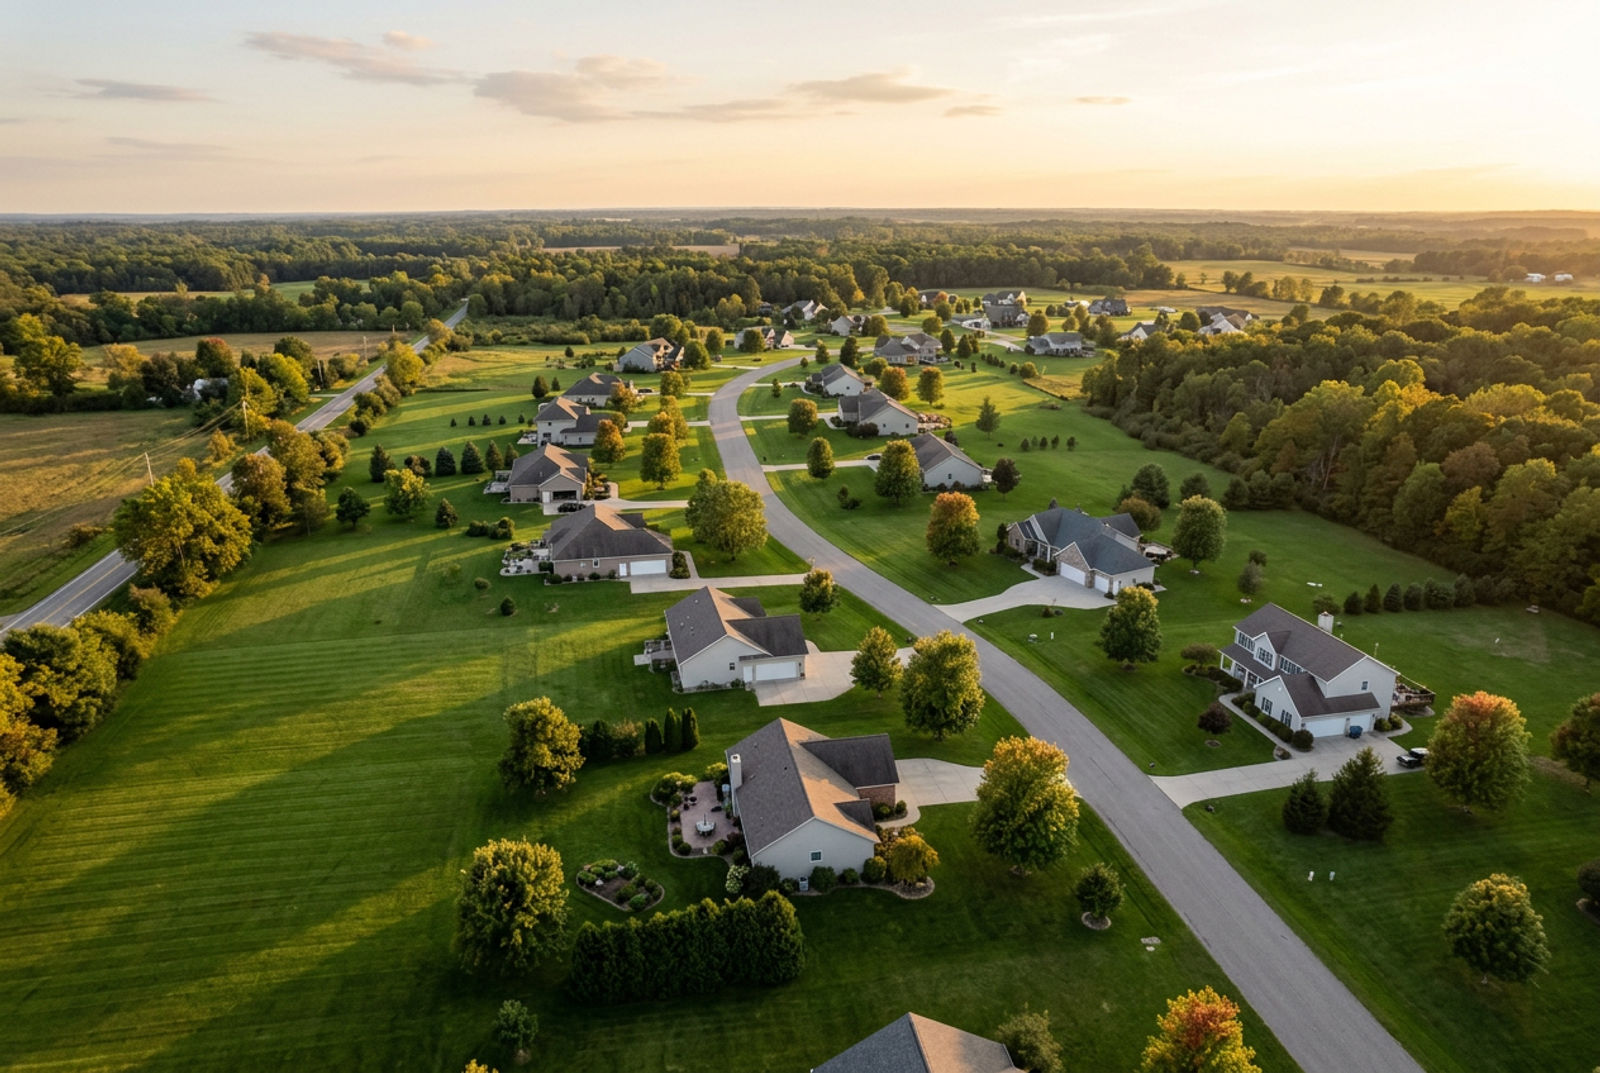
More than one in five American homes isn't connected to a public sewer — they treat their own wastewater on-site, in a septic system in the yard. That's about 21 million households, serving more than 60 million people. Septic isn't just old rural infrastructure, either: 17% of new single-family homes built in 2023 were put on septic. Yet the government's most-quoted count is 35 years old. This report gathers what's actually known — and shows where the famous numbers come from.
The headline numbers
About 21 million American households — roughly one in five — rely on septic systems.
More than 60 million Americans are served by septic and other decentralized wastewater systems.
17% of new single-family homes built in 2023 were served by an individual septic system.
SepticTankHub tracks 10,584 septic-service companies across 51 states and 5,763 cities — the largest such directory in the country.
The national picture
The Environmental Protection Agency says more than one in five U.S. households depend on a septic or other decentralized system. Depending on the source and year, that's roughly 16% to 25% of all occupied homes — the range itself tells you how imprecise the count is.
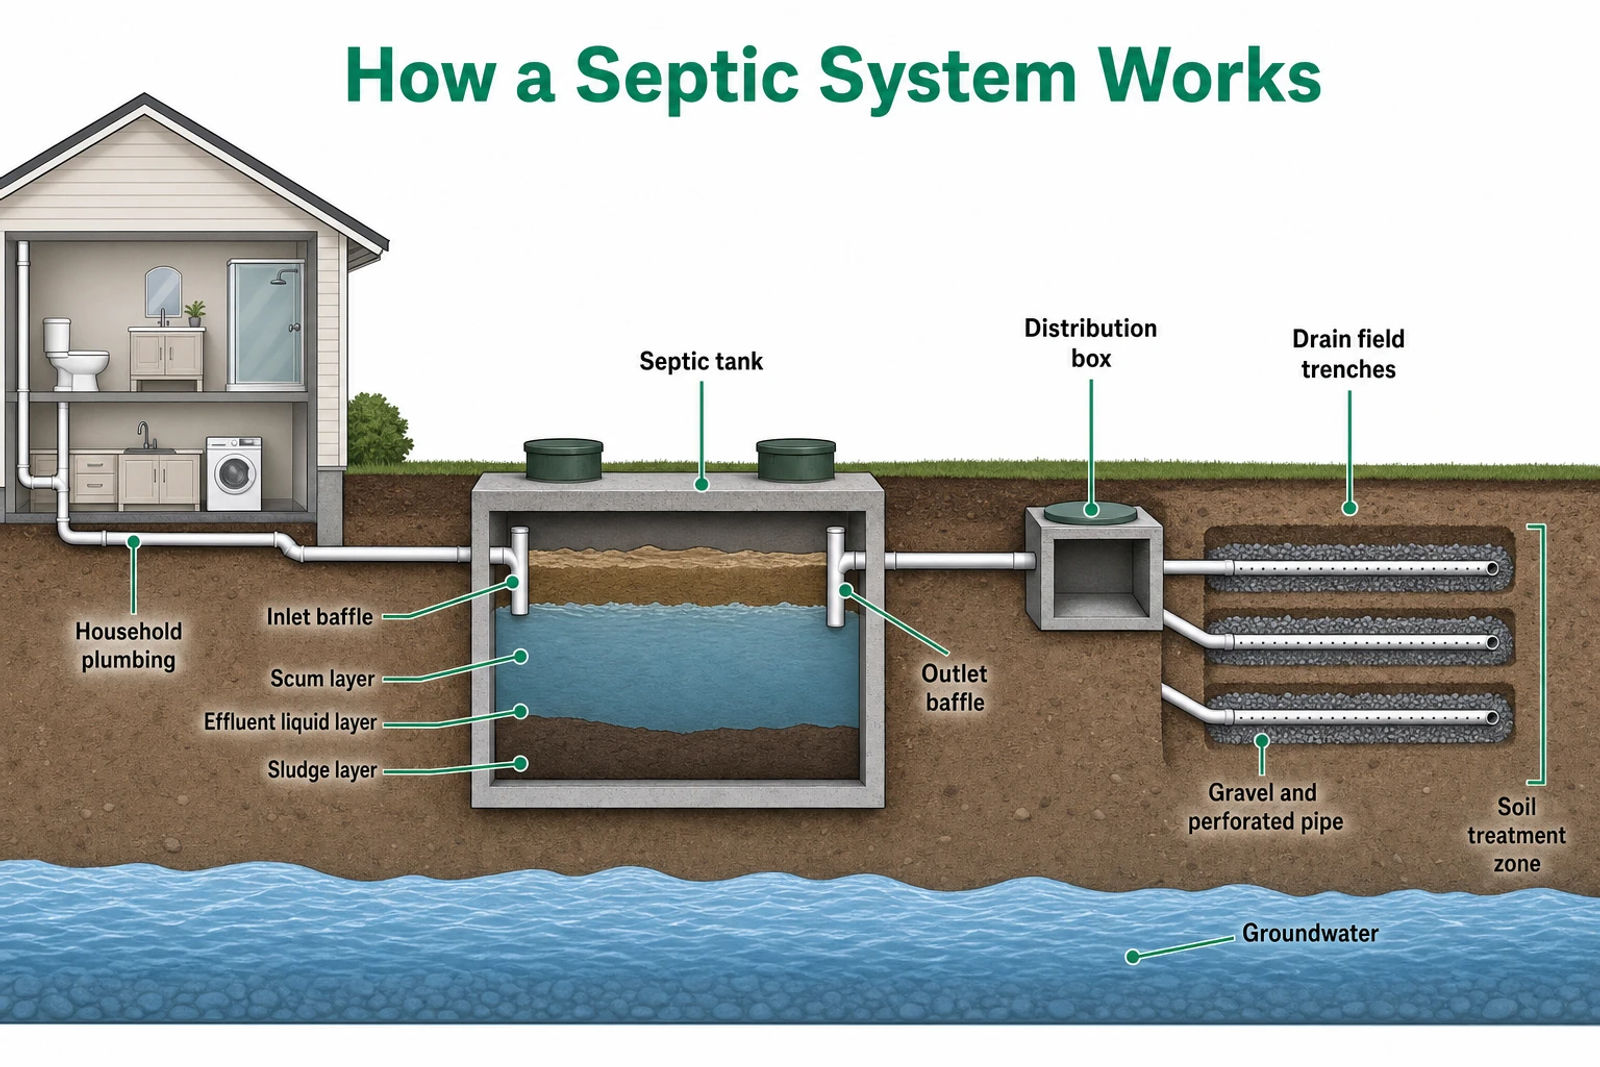
More than 60 million Americans are served by septic and other decentralized wastewater systems.
For context on scale: that's more people than live in California, Texas, and Florida's largest cities combined, all relying on a tank and a drain field rather than a municipal treatment plant.
Where the “21 million” number really comes from
Nearly every article about septic systems cites the same figure — “about 21 million” or “one in five.” Almost none explain where it comes from. Here's the honest answer.
The widely cited "21 million households" figure originates with the 1990 Census — the last time the federal government fully counted septic systems. The Census dropped the question after 1990; every number since is a survey estimate.
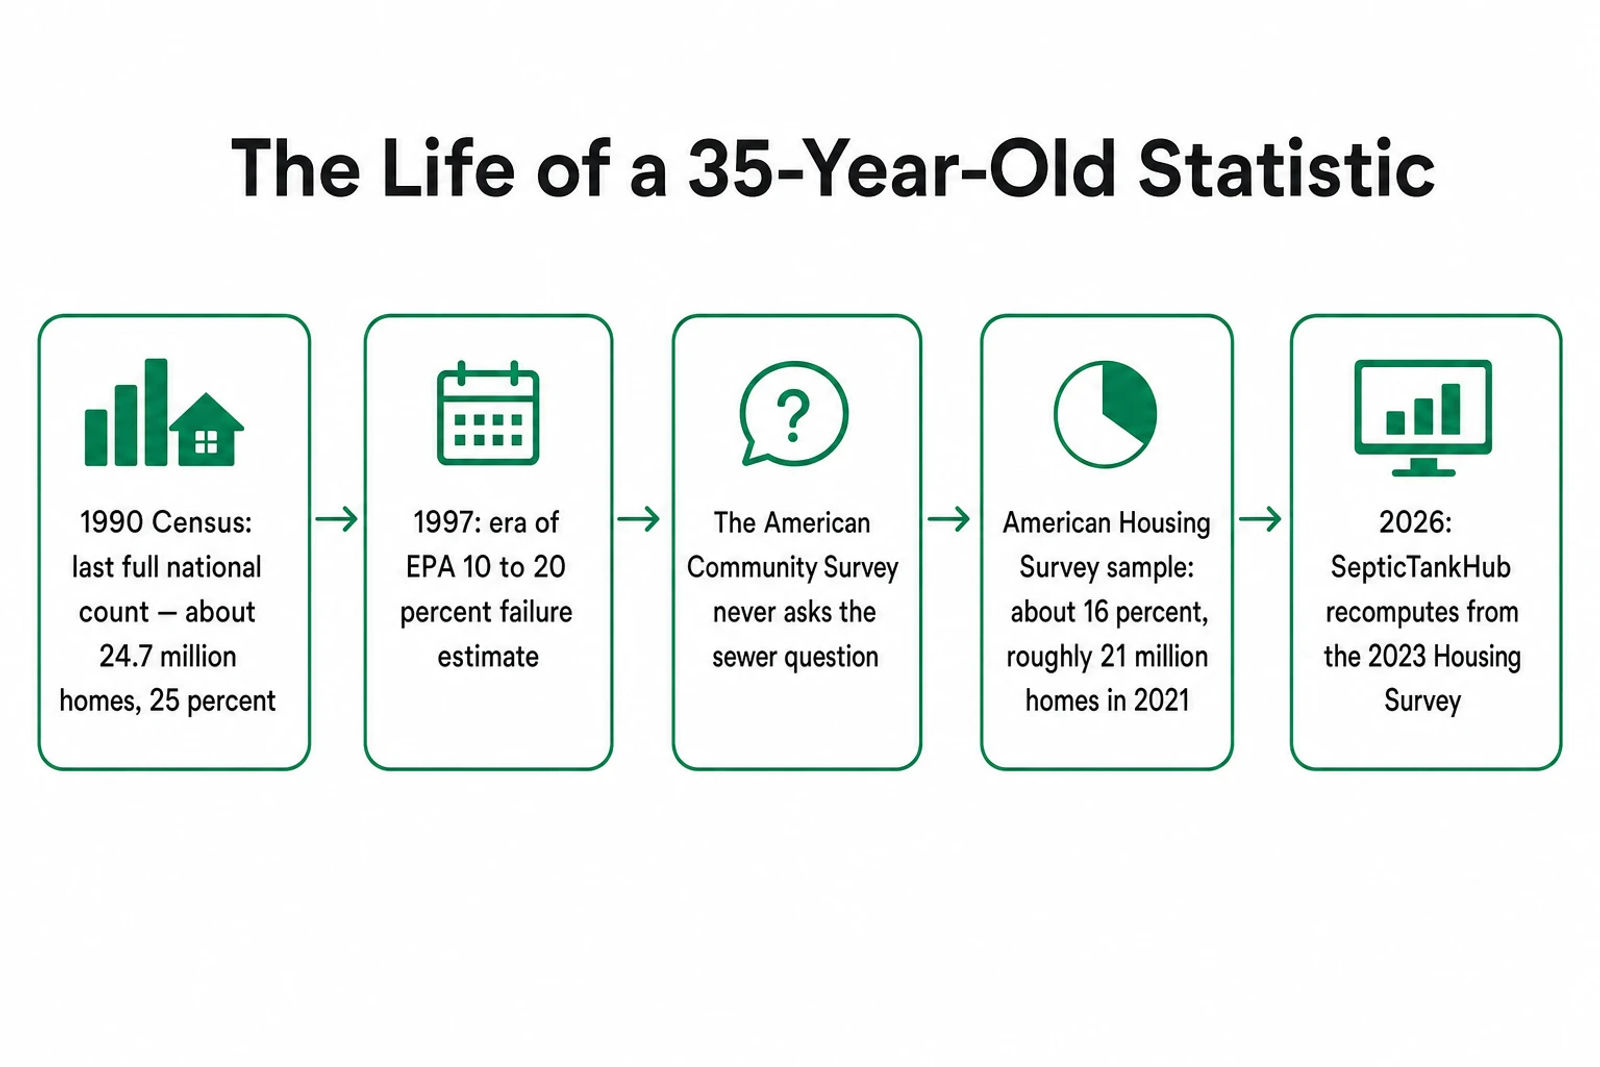
The 1990 decennial Census counted roughly 24.7 million homes (about 25%) on onsite systems. Then the Census Bureau dropped the sewer question, and the American Community Survey has never asked it. Every figure since is a sample estimate from the biennial American Housing Survey, which put the share near 16% (~21 million homes) in 2021. The Census Bureau's own research notes the survey undercounts septic use — so the real number is likely higher. When you read “21 million septic systems,” you're reading a 35-year-old count, lightly refreshed.
Septic service companies by state
Federal data can't tell you how many septic systems each state has today — the count hasn't been taken since 1990. But we can measure something no one else has: the septic-service industry. The map below shows the 10,584 companies in the SepticTankHub directory by state — a proxy for where the country's septic systems actually are.
10,584 septic-service companies operate across 51 states and 5,763 U.S. cities in the SepticTankHub directory.
Texas has the most listed septic-service companies of any state — 742, reflecting both its size and its heavy reliance on septic in rural and exurban areas.
| # | State | Septic Companies ▼ | Cities Covered |
|---|---|---|---|
| 1 | Texas | 742 | 328 |
| 2 | Florida | 659 | 202 |
| 3 | California | 533 | 223 |
| 4 | North Carolina | 476 | 249 |
| 5 | Georgia | 464 | 207 |
| 6 | Ohio | 446 | 262 |
| 7 | New York | 441 | 289 |
| 8 | Michigan | 399 | 251 |
| 9 | Wisconsin | 381 | 250 |
| 10 | Pennsylvania | 360 | 251 |
| 11 | Illinois | 311 | 214 |
| 12 | Tennessee | 300 | 140 |
| 13 | Minnesota | 285 | 193 |
| 14 | Missouri | 283 | 143 |
| 15 | Massachusetts | 265 | 164 |
| 16 | Connecticut | 254 | 122 |
| 17 | Indiana | 253 | 151 |
| 18 | Alabama | 229 | 130 |
| 19 | South Carolina | 229 | 110 |
| 20 | Virginia | 227 | 132 |
| 21 | Maryland | 226 | 115 |
| 22 | New Jersey | 211 | 122 |
| 23 | Washington | 204 | 91 |
| 24 | Kentucky | 189 | 114 |
| 25 | Oklahoma | 180 | 90 |
| 26 | Louisiana | 174 | 85 |
| 27 | Iowa | 153 | 112 |
| 28 | Colorado | 147 | 79 |
| 29 | Arizona | 129 | 59 |
| 30 | Oregon | 124 | 67 |
| 31 | New Hampshire | 116 | 84 |
| 32 | Mississippi | 108 | 66 |
| 33 | Maine | 96 | 81 |
| 34 | Arkansas | 95 | 66 |
| 35 | Montana | 93 | 51 |
| 36 | Kansas | 92 | 67 |
| 37 | Rhode Island | 83 | 33 |
| 38 | Idaho | 82 | 42 |
| 39 | New Mexico | 74 | 41 |
| 40 | West Virginia | 64 | 50 |
| 41 | Nebraska | 61 | 41 |
| 42 | Vermont | 60 | 51 |
| 43 | Utah | 54 | 35 |
| 44 | North Dakota | 50 | 30 |
| 45 | Alaska | 32 | 12 |
| 46 | Delaware | 32 | 21 |
| 47 | South Dakota | 31 | 21 |
| 48 | Nevada | 31 | 12 |
| 49 | Hawaii | 28 | 16 |
| 50 | Wyoming | 26 | 15 |
| 51 | District of Columbia | 2 | 1 |
51 of 51 rows · click a column to sort · click a row name to link it
Historically, the most septic-reliant states are in New England and the rural South. The last full federal count (1990) ranked them like this — dated, but the geography hasn't moved much:
- VT: ~55% of homes on septic (1990 Census)
- NH: ~50% of homes on septic (1990 Census)
- ME: ~50% of homes on septic (1990 Census)
- NC: ~48% of homes on septic (1990 Census)
- KY: ~40% of homes on septic (1990 Census)
- SC: ~40% of homes on septic (1990 Census)
- CA: ~10% of homes on septic (1990 Census)
Source: U.S. Census 1990 via EPA archived overview. Presented with its 1990 date because no newer full state-level count exists.
New construction
Septic is not a relic. Roughly one in six new single-family homes goes up on a septic system every year, concentrated in rural and exurban markets where sewer mains don't reach. If you're building, planning, or buying new in those areas, a septic system is a live design decision — see our tank size calculator and installation cost guide.
What septic systems cost
Costs vary enormously by soil, system type, and local code — enough that they deserve their own dataset. Our companion Septic Cost Index by State compiles permit fees and install/pumping costs across all 50 states from published fee schedules. In brief: routine pumping runs a few hundred dollars every 3–5 years, while replacing a failed drain field can run into the tens of thousands — the gap that makes maintenance the cheapest insurance a septic owner can buy (see pumping costs and drain-field replacement costs).
We don't publish a single “national average” install cost here because an honest one requires the state-by-state permit and quote data compiled in the Cost Index — inventing a round number would be exactly the kind of unsourced stat this report exists to correct.
Failures & risk
The EPA publishes no current national septic failure rate. The widely quoted “10–20% fail” figure dates to 1997-era EPA literature and should not be presented as a current statistic.
It's tempting to put a scary percentage here. We won't, because an accurate one doesn't exist. What we can say honestly: failure risk is driven by soil suitability, system age, and maintenance — the factors our county-level Septic Failure Risk Index scores. Meanwhile, only a handful of states even require a septic inspection when a home is sold (Iowa, Massachusetts, Delaware, Rhode Island, and New Hampshire's waterfront rule), which our inspection guide covers.
SepticTankHub Research. “Septic System Statistics 2026: The State of America's Septic Systems” (Report #1), July 2026. https://www.septictankhub.com/blog/septic-system-statistics/. Free to republish with attribution and a link. Each statistic above has its own anchor link for direct citation.
Methodology & sources
Methodology & Sources — data as of 2026-07-07
Federal reliance figures are survey estimates; there is no national septic registry. See per-stat honesty notes.
Directory company counts are listings in our database, not a census of all operating businesses.
Pumping-cost medians derive only from companies that publish pricing; per-state sample sizes are shown.
Company counts are directory listings, not census counts of all operating businesses.
pumpCost medians derive from companies with published pricing (pumpCostN per state shows the sample).
County rows require >= 5 companies to avoid small-sample noise.
- EPA has cited ~21.5 million households. The original full count is the 1990 Census (~24.7 million units / ~25%); the 2021 American Housing Survey re-confirms roughly 16% / ~21 million. There is no federal septic registry — all current figures are survey estimates that likely undercount.
- EPA states this without a dated citation; the figure traces to the 1990 Census and is roughly re-confirmed by the American Housing Survey.
- EPA publishes NO current national failure rate. The commonly repeated '10–20% fail' figure traces to 1997-era EPA literature and must never be presented as a current EPA statistic. Where a failure figure is used, attribute it to its original dated source.
- U.S. EPA — About Septic Systems — Household reliance figure ('more than 1 in 5'). (accessed 2026-07-06)
- U.S. EPA — SepticSmart Week — ~21 million households; 2026 dates. (accessed 2026-07-06)
- U.S. Census Bureau — Historical Census of Housing (Sewage Disposal) — 1990 decennial — the last full federal count. (accessed 2026-07-06)
- NAHB — New homes with private wells and septic (Census Survey of Construction) — 17% of 2023 single-family starts on septic. (accessed 2026-07-06)
- SepticTankHub directory database — Nationwide septic-company directory compiled from public business listings; read-only aggregate snapshot. (accessed 2026-07-06)
Frequently asked questions
This is Report #1, published July 2026. We refresh it annually as new Census, USDA, and cost datasets are released; the URL stays fixed so citations compound. Media & data inquiries: [email protected]. See our press page for republish permissions and hi-res graphics.
